COVID-19 Relief for Life Insurance Companies: LDTI

The mystery was about to end.

ASU 2018-12 spelled out a new methodology for calculating reserves for life insurance products. Kenji had worked many months to calculate the Liability for Future Policy Benefits (LFPB). He was exhausted. Yet, he was relieved. Cohorts were set up. The models were working as anticipated. Best estimate assumptions were in place. He had completed extensive single cell testing in Excel. The new roll forward reserve calculations allowed him to compute the reserves either retrospectively or prospectively. The roll forwards served as an excellent way to check the validity of the calculations. He was ready for a break. He handed over the initial reserves to the finance area. It was a time for a celebration with friends.

The celebration was short lived. The finance team called. They had placed the newly computed LFPB reserves into the overall financials. The results looked good, perhaps too good. Profits were very positive. The finance team was convinced a mistake had been made. No one in life insurance was supposed to have large profits now. Extra death claims due to COVID-19 had decimated results for the last year. Yet now, with the newly calculated reserves, profits appear to be good.

Kenji was tasked with figuring out what had gone wrong.

Some Basic Mechanics

ASU 2018-12 is also known as LDTI (Long Duration Targeted Improvements).  It is applicable for insurance companies that report under US GAAP.  LDTI made some major changes on how to compute reserves for traditional life products, such as term and whole life.  These reserves are known as LFPB.

The basic formula for the change in LFPB for the current reporting period is:

Actual Premiums * Net Premium Ratio (NPR)

+ Interest Accrual on LFPB

– Actual Benefits

+ True Up Impact                                      

Before LDTI, nearly no one had ever seen a simple formula for a change in a reserve.  It was a mystery.  But it was no longer a mystery.  The change in LFPB, often one of the most important items on an income statement, is relatively simple.  It works like as savings account.  A portion of actual premiums are added into the LFPB each period.  Actual benefits are paid out of the LFPB. Interest accrues to the LFPB.  It begins at zero at policy issue, and it ends at zero after all the benefits have been paid.

What do profits look like?
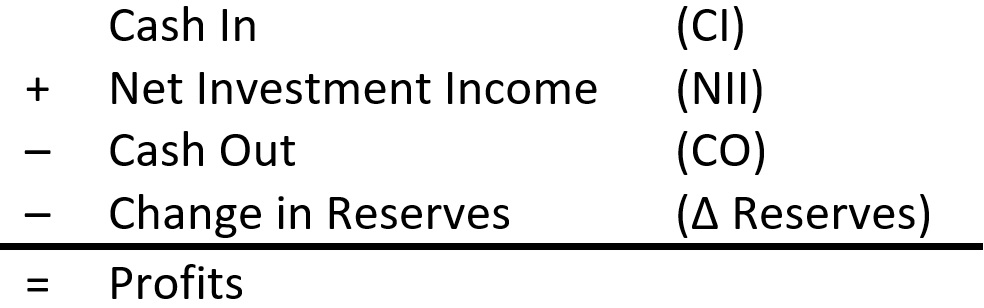
Normal Profit is:

Premiums

+ Investment Income

– Claims

– Change in Reserves

– Expenses

– Taxes

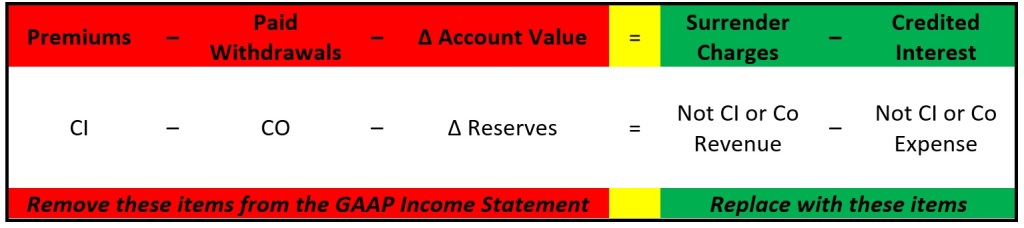
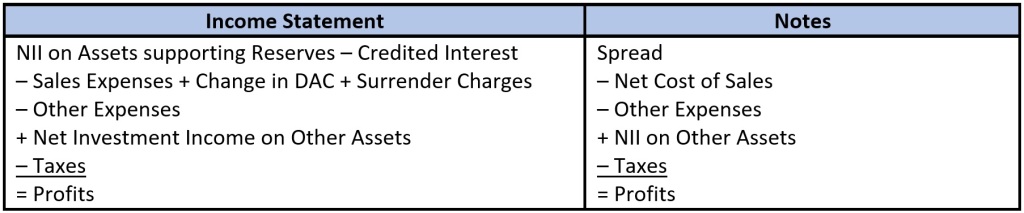
If we replace the “Change in Reserves” with the “Change in LFPB” we get:

Premiums * (1 – NPR)

+ (Investment Income – Interest Accrual on LFPB)

– True Up Impacts

– Expenses

– Taxes

Skip to the next section now if you are not really interested in all of the boring details.

The calculation is completed at the cohort level.  Cohorts are groups of policies defined by product type and issue year.

The NPR (Net Premium Ratio) is the amount applied to the Present Value of Gross Premiums to make Present Value of Net Premiums equal to the Present Value of Benefits as of the start date of the cohort.  Best estimate assumptions are utilized.

Cohorts will normally begin when policies are issued.  However, for many companies, cohorts will begin as of 1/1/2021, if they were issued before this date.  This is referred to as the modified retrospective approach. Many companies will not have enough data to do the calculations based on the original issue date.  There will be more on this topic later.

For each reporting period, normally a quarter, the NPR is recalculated.  It is always calculated over the life of the cohort.  After each quarter, for the present value calculation, one quarter’s worth of expected results is replaced with one quarter of actual results.  This has the impact of increasing or decreasing the NPR as needed.

If reality matches expectations, then the NPR never changes for a given cohort.  If things are better than expected, then the NPR goes down.  If things are worse, the NPR goes up.

Of course, there was one mystery element.  It was for the “true up impacts”.  This amount goes by many names.  This includes items like “Effect of changes in cash flow assumptions,” and “Effect of actual variances from expected experience.”  These are adjustments related to actual experience on mortality, morbidity and lapses not matching up to the assumptions used in the calculations.

If you do not have enough boring details yet, read ASU 2018-12 (FASB Org Link to ASU 2018-12).

When is it a good time for a pandemic?

The answer of course is never.  But if there is going to be a pandemic, it is best that it happens when ASU 2018-12 is being implemented.  Actual claims, even COVID-19 claims, are paid from the reserve.  The drop in the reserve offsets the actual claims being paid, producing no profit/loss impact.  Actual claims drop out of the equation from the previous section.

Wait a second!  This cannot be true.  OK, there is a profit/loss impact.  It is very muted, at least for now.   The reserving mechanism spreads excess claims (or smaller than expected claims) over the life of each cohort.  Since most companies will have their cohorts starting as of 1/1/2021, most COVID claims will be spread out into the future. 

No one wants a pandemic, but if there is a pandemic, LDTI could not have come at a better time.

But wait, there’s more!

So, LDTI has helped out with COVID claims.  Yet, the profit levels still seemed too high.  Kenji couldn’t help thinking about this.  Then it hit him.  The transition rules were producing steady streams of profit.

Under a true LFPB calculation, one needs the history of premiums and claims for all policies since the day they were sold.  Tracing back all of this information can be a daunting task, as some policies in force were sold 50 or more years ago.  So LDTI allows the modified retrospective method. 

Under the modified retrospective method, one chooses a transition date.  For most companies this will be 1/1/2021.  The LFPB reserves, on a best estimate basis, are floored at the prior reserve amounts.  The prior reserves had margins built in.  Under LDTI, these margins are released as a constant percentage of premiums.

The NPR for old cohorts will be low in order to release more profit.  For some old cohorts, it is even possible for the NPR to be negative.

Under the old methods the margins would have been released when policyholders surrender or die.  However, this can be a long way off.  The LFPB rules allow for much quicker release of margins.

Disclosures

LDTI requires public disclosures showing the details on the change in reserves.  What was once an actuarial thing would soon become something anyone could figure out. Well perhaps not just anyone.  Investor Analysts could certainly figure it out.

Investor Analysts would soon be able to make much better predictions about the change in reserves.  Afterall, the details were there.  Things seemed relatively straight forward.  Then again, Investor Analysts tend to ask a lot of questions.  Kenji knew that any amount in the “true-up impact” section of the “change in reserve” disclosure would require explanation.  If things were worse than expected, Investor Analysts would want assumptions changed to strengthen reserves.  If things were better than expected, they would want assumptions changed so that profits could be released.  After assumption changes were made, it would be easier to predict profits.

It looked as if Investor Analysts would allow no relief.  Then again, they had never allowed relief in the past.  This was their job.

So, this was good?

Kenji had figured out a few major items. Perhaps it was time to celebrate. Perhaps not. Yes, there was more profit now. That’s a good thing, isn’t it? The flip side is that there would be fewer profits in the future. This was especially true for policies sold after 1/1/2021, which would not have any margin in reserves. Sooner or later, this would need to be explained.

Kenji had taken the job in traditional life valuation simply because it was steady and predictable. He could see this would no longer be the case.

Kenji had never worried about assumption changes. Under the old rules, assumptions were set at the time the policies were sold, and then never changed. He used to simply walk over to the pricing area, get their assumptions, add some margins, and then forget about it thereafter. Afterall, changes to assumptions were not generally allowed in the past. Under LDTI, assumptions must be reviewed. If reality was not matching up to the current assumptions, he knew that the Investor Analysts would hound Senior Management, who in return would hound him.

Kenji had never worried about parts of the income statement, other than the “change in reserves”. This would no longer be the case. The change in reserves would be related to both actual claims and the size of actual premiums. The interest accrual on LFPB would be compared to net investment income.

So, Kenji was exhausted. Yet he was excited. His job would soon become less boring.

Shady Practice or Consumer Benefit?

Many years ago, there were 6 of us at an actuarial staff meeting. The lead actuary explained what would happen next. One of the younger actuaries asked if this was ethical. There was silence. Then the lead actuary said, “Well, it is legal.” The young actuary said that was not the question. The lead actuary simply moved on to the next topic.

This blog discusses two methodologies which some would see as questionable. Both methodologies work to lower the cost of the insurance products for consumers. Yet some would see these methodologies as avoiding the intent of the law. They may make the products less safe. These methodologies appear to be legal, at least in most states.

The Two Schemes

The choice of the word “scheme” is intentional. In the US, the word generally has a negative connotation. In the UK, it retains a positive connotation. It is a grey term.

Both schemes have been aimed at lowering actuarial reserves. For products sold in the past, such as term life insurance, government (statutory) reserve requirements have been seen by some as very high. They are high, as unexpected things can happen. If the unexpected happens, insurance companies may need extra money to pay the promised. Insurance companies are required to back these reserves with hard assets, such as corporate bonds. These conservative reserve requirements forced owners of the insurance companies to make large investments of their capital when they sell products.

The large investment decreases the return on investment (ROI). The ROI can be found by comparing profit margins to the amount of investment. It is difficult to change the profit margins due to competitive pressures. However, as we will see, the two schemes can lower the amount of investment.

The First Scheme

As mentioned, insurance companies must back statutory reserves with hard assets.  Assets, such as a letters of credit (LOC) from a bank, are not seen as allowable assets for this purpose.  With a LOC, a bank guarantees that they will loan the insurance company a certain amount of money, in exchange for small annual fee.  In most cases the loan is never made.  It is available just in case the insurance company needs it.

LOC are not allowable assets for insurance companies for the purpose of backing statutory reserves.  Perhaps this is because it is individuals who often buy insurance products.  It may be difficult for individuals to judge items such as LOC when deciding on the safety of an insurance company.  However, reinsurance companies may use LOC to back statutory reserves.  Reinsurance companies do not sell consumer products. They only work with insurance companies.  Since reinsurance companies have knowledgeable customers, namely the insurance companies, they can use assets such as LOC.

So, here is how the scheme works.  An insurance company creates their own reinsurance company.  Such a company is called a captive reinsurer.  Then the term life products are reinsured with the captive reinsurer.  The captive reinsurer then backs a large portion of the statutory reserves with LOC.  This substantially lowers the amount of investment for the products.  The insurance company owners end up increasing their ROI, or reducing their prices, or a little bit of both. 

If something unexpectedly bad were to happen, the captive reinsurer could access the LOC and use this to pay the insurance company who in return would pay the consumers.  However, this tends to avoid the intent of the law to back reserves with hard assets. 

At one point in the past, some state regulators were actively helping insurance companies to set up captive reinsurers.  However, the practice varied widely from state to state.  Not all state regulators agreed with the practice of captive reinsurers.

The Second Scheme

Insurance regulation is enormously complex in the US.  The laws vary by state.  If any insurance company is selling in all states, they must comply with the regulations of 50 states.  The rules related to the state of New York are onerous. To deal with this, most large insurance organizations have at least two legal entities (insurance companies).  One of these would sell products just in New York, whereas the other would sell products in the other 49 states. The insurance organizations may set up more legal entities for other purposes.  These legal entities may all fall under a large insurance holding company.

The assets of the large insurance holding company are basically its ownership of the individual insurance companies.  Its ownership in these companies is seen as a hard asset.

So, here is how the scheme works.  The smaller legal entities, those doing business directly with consumers, reinsure the products with the large insurance holding company.  A large part of the statutory reserves is backed by the ownership in the smaller companies, rather than bonds. This substantially lowers the amount of investment for the products.  The insurance company owners end up increasing their ROI, or reducing their prices, or a little bit of both.

If something unexpectedly bad were to happen at one of the individual insurance companies, then the holding insurance company would need to sell one of the other insurance companies to pay benefits.  If something bad happens simultaneously to all the individual insurance companies, the situation becomes more problematic.

Please note that the State of New York does not allow such a scheme.  It is allowed by many other state insurance departments.

How Much of the Statutory Reserves Are Impacted?

Life insurance companies normally compute at least two types of reserves.  The first type is Statutory, and these reserves must be back by hard assets.  The second type is GAAP, and these reserves are used for SEC reporting.  Statutory reserves for life insurance products are typically higher than GAAP reserves.  Under the first scheme, LOC are generally used to back the difference between Statutory and GAAP reserves.  Under the second scheme, ownership in the various legal entities is used to back the difference between Statutory and GAAP reserves. 

The difference between Statutory and GAAP reserves is sometimes called redundant reserves.  However, this is a bit of a misnomer.  The Statutory reserves are exactly as intended, and as such, no part is redundant from the perspective of the regulator.

How Things Currently Work

The above two schemes are currently being used by several insurance companies.  In some cases, state regulators have disallowed these schemes, and insurance companies have been forced to increase the amount of investments to cover statutory reserves.  Still, many insurance companies continue to use these methodologies. 

The various state regulatory bodies have recently instituted new statutory reserve rules known as Principles Based Reserves (PBR).  Under PBR, statutory reserves will be substantially less for many products.  The use of the above two schemes for new products is expected to drop drastically.  However, this does not help products currently in force.  It only helps for new products being sold.  Also, I have heard grumblings that the PBR approach does not work as well as the last two schemes.  Hence some companies may still want to attempt to use these schemes in the future.

Some insurance companies actively try to comply with the intent of the law.  They may be able to do so, as they are still able to sell products at a higher price.  Many people do not compare prices when shopping for life insurance.  For others, following the intent of the law may result in staying out of some product segments, as they are unable to compete.

Last Thoughts

Many insurance companies use various schemes to improve their financials.  There are many schemes other than those mentioned above.  Such schemes can work to lower prices.  A company may choose not to use such schemes.  Unfortunately, this often results in not being able to sell a product.  This can lead to the undesirable situation of having to find other products to sell.

Actuaries are often faced with ethical questions like whether to use one of the above schemes.  The questions are never easy to answer.  Making use of loopholes can obviously help to lower the cost for consumers.  It is possible that laws are perceived to be out of date by everyone, and hence using the loopholes may make sense.  However, perceptions vary widely, and the fact that insurance companies often deal with 50 state regulatory bodies adds to the confusion.

In terms of the above two schemes, the National Association of Insurance Commissioners (NAIC) has responded through the introduction of PBR.  PBR significantly lowers reserve requirements for certain products.

On a final note, in the case of the opening paragraph, the incident was reported to the company’s compliance function.  The lead actuary was instructed to tell the group of actuaries that it was company policy to follow the intent of the law.  Many companies have structures to handle ethical questions.

Have you been faced with ethical issues?  How were these resolved?  Write to me at dmxure@gmail.com.

Math is Easy, People Are Hard: Creating Policyholder Behavior Assumptions

Adapted from Intro scene from the movie “A Boy Named Charlie Brown”(1969).

Developing excellent assumptions is becoming more and more important.  Both Principles Based Reserves and GAAP Targeted Improvements will place increased scrutiny on assumptions.  This blog will discuss how to build a dynamic policyholder behavior assumption.  There will be an Excel spreadsheet example.  There will also be discussions about predictive modeling on R or SAS or Python.  The math for all of this is easy.  That’s because it has been largely automated. The people involved with process may not be as easy.  That includes the policyholders.  That includes an insurance company’s internal staff.  That includes external reviewers.

Excel Example: Building a Dynamic Policyholder Behavior Assumption

When I took actuarial exams, they had a calculus exam.  I actually scored a 10 on the exam.  I also taught first and second semester calculus as a teaching assistant in grad school.  Looking back at this, it seems like such a waste.  I still need calculus methods to find maximums and minimums, but Excel does this for me.      

So, here is the spreadsheet that we will use to build a dynamic lapse function.  Excel will handle the calculus needed for an optimal solution.  You can download it by clicking on the link. 

https://dmxure.files.wordpress.com/2019/11/dynamic-lapse-function.xlsx

The spreadsheet shows one how to build a dynamic surrender formula for a deferred annuity.  In real life the process may require a few weeks.  While this may seem like a long process, sourcing and cleaning data can take much longer.  And as you will see shortly, the review process can be very long as well.  

A video on how to use the Excel spreadsheet is shown below.

The form of the dynamic surrender formula in shown below.  There are two parts.  One varies by policy duration and the other varies by the interest crediting rate.  This is a starting point.  More adjustments can be added later.

Surrender Rate = Base Rate * Adjustment for Crediting Rate

Where

  • The base rate varies by policy duration
  • Adjustment = 1 + a * arctangent (b * (crediting rate – competitor rate))
  • The values of a and b are selected to align with historical information
  • The competitor rate is estimated using a treasury rate plus a spread.

The base rate varies by policy duration primarily due to the surrender charge schedule.  The adjustment to surrenders is related to the fact that if one is crediting less interest than competitors, the surrenders will increase.  Excel is used to find optimal values of a and b to fit the data.

Why use an arctangent function?  Because when one plots out historical data, this is what it looks like.  Look at the spreadsheet.  Sometimes the data will resemble an exponential function.  Other times it may look like a parabola.  There are many factors associated with choosing a function.  For example, one could have just as easily chosen a straight line with a maximum and a minimum value. 

The neat thing about this process is that additional adjustment factors can be added.  For example, tax rules encourage people to take surrenders at age 59½.  Hence it may be desirable to make adjustment factors at this age.  One may also see spikes in surrenders at age 65, the normal retirement age.  Product features such as a market value adjustment can dampen the need for a credited rate adjustment during the surrender charge period.  Sex may play a role.  The list goes on and on. How does one decide that they have added enough adjustment factors?  As you will later see, there will be many people involved with the review process.  They will have opinions.  For example, people in risk management may want complicated formulas, to understand impacts during extreme events, such as the financial crisis.  People in pricing may be good at finding drivers important to lowering premium rates.  The IT department may not want complexity. The added complexity may not be needed if one only needs a best estimate assumption.

Other Policyholder Behavior Assumptions

There are several other policyholder behaviors that can be modeled.  Many of the same predictive modeling techniques used for deferred annuities lapses can be used for these behaviors.  Examples include the following:

  • Surrenders for variable annuities with living benefits, with the surrenders being based on in-the-moneyness
  • Suicides during a financial crisis
  • Election of annuitization options based on interest rates
  • Continuation of premiums past the term period for term life insurance, based on the amount of the premium increase

Predictive Modeling with Other Tools

Excel is a good way to start predictive modeling.  Predictive modeling using R, Python or SAS is another route.   The first two are free.  SAS will cost you some money, but people have told me it is easier to use.  People who use R and Python will argue this assertion.  So why use one of these platforms?

  • They will allow one to rank order variables for an assumption by correlation.  One can test dozens of variables at once, and determine which have the highest correlation with a target.
  • There may be automated routines to build a dynamic formula within the platform.

Should I Only Use Historical Data to Create a Dynamic Formula?

Nope.  The examples above may be referred to as predictive modeling.  Predictive modeling is a great tool.  Using predictive modeling, one can do an excellent job of predicting the past.  Unfortunately for life insurance assumptions, we usually need to predict the future.  The past can be a great tool for predicting the near-term future.  It becomes less useful for longer term projections.  Life insurance projections often run for 30 to 50 years.  One should carefully consider things which could change in the future.  For example:

  • Future Product Features – Some products have features that do not kick in until after 10 years.  If the product has only been around for 8 years, the actuary may need to estimate an adjustment factor.
  • Changes in Government Rules – It was already mentioned that certain government rules encourage surrenders at 59½.  One should look to see if there is any recent legislation which could impact the assumption.
  • People Getting Smarter – Policyholder decisions do not always seem to make sense from a financial standpoint.  Do you have reason to believe policyholders will become more financially efficient in the future?  Have there been consumer education programs that could change behavior?
  • Limited Credibility – Your assumption setting process may reveal that credibility is limited for certain parts of the assumption.  Judgment may be needed to fill in the gaps. 

Discussions regarding modifications for the above can be intense.  As we will later see, insurance companies have many experts, and all opinions will need to be considered.

Some of the predictive modeling programs are based on correlations.  For long term assumption setting we are looking for cause and effect.  Correlation is not the same as cause and effect.  I can show a strong correlation between ice cream sales and drownings.  Some may see this as people jumping into the pool less than one hour after eating ice cream.  However, the more likely reason is that the longer it is hot outside, the more that people will want to eat ice cream and go swimming.  Cause and effect are important to long term projections, and one must stop and think about variables when using predictive modeling.

Finally, we may find a factor that has a definite impact on the assumption at hand, but it may not be immediately helpful.   For example, the unemployment rate may be a great predictor of universal life surrenders.  However, if one has not yet determined how to project unemployment rates, the point may be moot.

People are Hard:  Understanding Policyholders

One will need to understand policyholders.

Policyholders are constantly changing.  Attitudes towards marriage, retirement, having children and other things can affect how policyholders make decisions about their insurance policies.  It could be that the Society of Actuaries may want to focus more on psychology and sociology in the future.

Policyholders do not always make decisions in the same fashion as actuaries.  Actuaries need to think like policyholders when choosing assumption.  For example, an actuary may have made a dynamic surrender formula based on an option budget, because the option budget is how they would decide on when to surrender.  Having said this, many policyholders have no idea what an option budget is, and hence may not be a factor for them.  Fortunately, through the above processes, one can test out theories.

People are Hard:  Internal Resources & Other Parties

Actuaries who want to perform experience studies, and develop assumptions, must typically talk with these internal parties.

  • IT – Good data is needed.  IT teams are a start.  If you are at a big company, data may come from dozens of systems.  The reason for several systems is that blocks of policies may have been acquired by buying companies.  When the companies were bought, the systems were never converted.  Not only that, good data dictionaries may not exist.  This is because the original builders felt that everything was obvious.  It probably was in 1993.  Unfortunately, now it is 2019.  Good data often involves long discussions with IT.
  • Operations – One needs to understand the data.  Operations uses data daily to administer policies.  They understand it.  IT can make sure one has complete data in terms of policy counts or account values.  Operations is needed in order to ensure that you have pulled the right data.  For example, they will understand the three fields needed to perform a market value adjustment (MVA) calculation.
  • Investments – Interest rates and equity returns are often highly correlated to policyholder behavior.  Investment professionals often have access to historical information from things such as Bloomberg machines. Good investment people can help one gather this data.
  • Sales / Marketing – People within the sales and marketing department are often talking with those out in the field.  This includes agency forces as well as independent brokers/dealers.  People in the field can provide excellent information on customer behavior, although I have been told that it is only as good as the last sale.

Many teams will be impacted by changes in policyholder behavior assumptions.  Teams generally do not want change.  It is extra work, and it may not have immediate benefits. Additionally, it is human nature to believe one’s team is the most important function at an insurance company.  Changes to policyholder behavior assumptions may be an intrusion to what they do.   Teams to consider:

  • Pricing – Changes to assumptions may impact pricing.  Pricing actuaries tend to get positive recognition if they can produce low prices.  If an assumption change causes prices to increase, one should expect long discussions about the changes.  This scrutiny can very much help to improve the assumption setting process.
  • Valuation – Valuation teams, the actuaries who produce reserves, need to produce a lot of calculations in a short period of time.  Changes to that process can result in many long nights at quarter end.  As a result, push back against changes to assumptions can be large.
  • Modeling – Actuarial models are often complex.  Introduction of a new policyholder behavior assumption can require extensive validation.  Some modeling teams may want to avoid long dynamic policyholder behavior functions due to run time considerations.
  • ALM – A normal part of asset liability management is to project product cash flows, such as premiums and claims.  This is then used to set up a portfolio of assets that matches up asset cash flows.  Changes to assumptions can impact projected cash flows, which could impact segment portfolios.
  • Hedging – Similar to ALM, projected cash flows can have a major impact on hedging efforts.
  • ERM – Those in Enterprise Risk Management may want to have formulas sufficiently robust to recognize what may happens during extreme events, such as large market movements, or sudden interest rate changes.   
  • Senior Management – Senior management often looks for overall results to exactly match expected results.  Anything lower than expected will be considered bad.  Sometimes better than expected results is viewed negatively as well, as it may be an indication that insufficient information was given at the beginning of the year.  Senior management will want to understand changes.  If changes are large, then a good narrative is needed to explain results to stakeholders.

  Outside people will also play an important role.

  • External Consultants – If your change to an assumption results in a large financial impact, then senior management may want to bring in outside consultants to review your work. 
  • External Auditors – Auditors will want to understand assumption changes as well.  Assumption changes can result in large financial impacts.
  • Regulators – Regulators will be concerned about whether reserves are sufficiently large.  They may want to review your work.
  • Investors – When GAAP Targeted Improvements comes in a few years, experience studies will become part of the 10K/10Q disclosures.  Disclosures may be limited at first, but they could grow.  Working with this new audience could become tricky.

There are many parties involved with process.  Excellent communication skills become a priority in order to keep all parties properly informed.

Last Thoughts

The mathematics of building a dynamic policyholder formula are relatively easy.  The math part is often completed in just a few weeks.  The other parts of the process may require much more time.  Sourcing and cleaning data can take a long time.  Once the math has been completed for the proposed assumption changes, many parties will be impacted.  They may all want a say in the process, and those discussions can take a long time.  Excellent communication skills are critical for actuaries involved with assumption setting.

Do you have ideas for actuarial blogs?  If so, you can reach me at dmxure@gmail.com.

Accounting for Deferred Annuities

Deferred annuities are very similar to both bank and mutual fund products.

Spreadsheet

Some of you may like to go directly to the spreadsheet.  Just click on the link below.  It illustrates how to account for deferred annuities under both Statutory (at a high level) and US GAAP.

https://dmxure.files.wordpress.com/2019/11/deferred-annuity-accounting.xlsx

The spreadsheet follows a deferred annuity product over its entire life.  This deferred annuity has been priced to earn a 12% Internal Rate of Return (IRR), although one may vary this by changing the interest crediting rate.

Like other spreadsheets, calculations include a source of earnings analysis, along with extensive controls.

Introduction

Deferred annuities look remarkably like bank products.  They have account values.  Premiums act like deposits.  The account value is credited with interest.  Policyholders may be able to make withdrawals.  Because of the similarities, GAAP accounting for deferred annuities looks like bank accounting for savings accounts.  This blog explores the accounting treatment for deferred annuities.  This may be referred to as deposit accounting.

Universal Life (UL) was developed to make life insurance look like a bank savings account.  Hence the same principles apply to accounting for UL.

Some Basics on Deferred Annuities

If you are familiar with deferred annuities, then please skip to the next section.

Deferred annuities can be either single premium or flexible premium products.  Premiums act like deposits.  The deposits may also be referred to as considerations. 

  • Single premium products usually involve large deposits, e.g., $100,000.  These are typically sold to consumers in their late 50’s to late 60’s.
  • Flexible premium products allow contributions at any time.  Many 401(k) plans in the US are deferred annuities, with deposits corresponding to paychecks.   

Deferred annuities are credited with interest, which may be guaranteed, or with investment returns less fees from underlying investments.  Partial withdrawals may be allowed.  The policyholder has the option to convert the full amount into a series of payments at contractually determined rates, although this option is rarely exercised*.

There may be surrender charges for withdrawals made during a surrender charge period.  The surrender charge period can be between 0 and 17 years. Surrender charge periods serves two purposes.

  • Sales Charge Recovery – The surrender charges help to ensure that initial sales charges can be recovered if the policy surrenders early.
  • Higher Crediting Rates – The use of the surrender charge can enhance persistency, allowing insurance companies to invest in longer duration bonds.  This leads to higher credited rates.

Surrender charges may be waived at death, or for smaller partial withdrawals, say 10%. 

* One of the primary reasons for the downfall of the oldest insurance company in the world was a deferred annuity product.  It had very rich annuity options built into the contract.  When the contracts were written, the annuity options were not attractive.  Then things changed. The product’s lifetime annuity rates were based on a 6% discount rate.  In the early 1980’s a 6% rate was very low.  No one thought the 6% option would ever be used.  By the late 1990’s, 6% was pretty good. Many people exercised their options.  The insurance company ran out of capital, and was forced to stop writing business.  This led to an examination of the actuarial profession in the UK.

Deposit Accounting:  Part Algebra, Part Source of Earnings

If you will recall, a simplified income statement looks like this:

This is pretty much how things work for Statutory Accounting for annuities.  Deposits are a CI item.  Withdrawals and expenses are CO items.  For Statutory Accounting, calculation of the reserves is quite complex, but at the end of the day they are somewhere between the surrender value and the account value.

For GAAP accounting the reserve is simply the account value.  One can arrive at the correct GAAP profits by simply:

  • Starting with the Statutory Accounting
  • Swapping out Statutory Reserves
  • Swapping in GAAP Reserves, which in this case are account values

While this methodology will give one the correct GAAP profits, it will not provide the proper presentation.  For a bank product, deposits are not considered revenues (CI), as these belong to the customer.  Likewise, withdrawals are not considered expenses (CO), as this is simply the customers money.  For a bank, credited interest is an expense.  However, for an insurance company, credited interest is not either CI or CO, it is part of the change in reserves. 

So, what do we do?  We move to something referred to as deposit accounting.  It begins with an account value roll forward. 

Next, we apply some algebra to rearrange the items.

The items on the left are removed from the GAAP income statement, and they are replaced by the items on the right.  Premiums are not considered revenue.  They belong to the customer, not the insurance company.  Withdrawals are not an expense for the same reason.  What matters to the insurance company are the surrender charges and credited interest.

All of this leads to a very good Source of Earnings Analysis for deferred annuities under US GAAP.

Last Thoughts

Unlike life insurance, there are no judgment calls in determining US GAAP reserves for a deferred annuity.  It is simply the account value.  This leads to the use of deposit accounting, the same methodologies used by the banking industry.

Some deferred annuities offer extra optional benefits.  One such common option is the Guaranteed Minimum Withdrawal Benefit (GMWB), which allows policyholders to continue withdrawals for one’s whole life, even if the account value goes to zero.  Setting the reserve for these benefits is beyond the scope of this blog, and may be covered in future blogs.

Do you have ideas for future blogs?  If so, send this to me at dmxure@gmail.com.

Providing Stock Market Guarantees on Insurance Products

Bob started to wonder if this was too good to be true…

I listen to old people’s radio stations and watch old TV shows.  It is not unusual to hear ads like this, “How would you like to make money when the stock markets go up, but lose nothing when the markets go down?”  Gee, that sounds pretty good.  This blog explores the construction of these products.

How does an EIA product work?

(Please skip this section if you already know how an EIA product works.)  Equity Indexed Annuities (EIA) have been around for a long time.  The legal term for these products is Fixed Indexed Annuities (FIA).  Both EIA and FIA serve as non-descriptive names.  I will stick with EIA for this blog. 

An EIA is a deferred annuity.  Any deferred annuity is a savings product.  Deferred annuities compete with bank savings accounts, certificates of deposits, and mutual funds.  The normal definition of an “annuity” is a series of payments.  Any deferred annuity has a series of payments option.  This option is typically utilized less than 1% of the time.  So effectively deferred annuities are simply savings products.

Let’s look at a normal fixed deferred annuity.  We will pull in the indexed part a little later.  It begins with a large one-time deposit by a customer.  This is typically in the range of $100,000.  Often this is made by someone in their late 50’s to their late 60’s.  The fixed deferred annuity works with account value.  Deposits are placed into the account value, and interest is credited on a regular basis.  Normally interest crediting rates are guaranteed for one year.  The interest rates are updated each year at policy anniversaries.  The money can be withdrawn at any time.  However, if it is withdrawn during the first few years, say 7, there will be penalty charges. This is referred to as the surrender charge period. The interest crediting rates tend to be attractive compared to bank savings accounts.

An EIA product is very similar to a fixed deferred annuity.  Rather than crediting a declared interest rate, a person receives some type of positive movement on a market index.  These are called options.  Examples of options include the following:

  • 65% (participation rate) of the positive movement of the S&P 500 Index over a 1-year period
  • 100% of the positive movement of the S&P 500 Index subject to a maximum of 8% (cap rate)
  • 60% of the positive movement of the Russell 2000 Index

Of course, there may be several other options. Policyholders can generally change options once per year at policy anniversary. Each year the participation and cap rates may change.

You may be wondering how an insurance company can safely provide these guarantees. It is not too hard. They take expected interest on the underlying bonds used to support the product and use these amounts to purchase call options on the open market. These call options are directly aligned with the guarantees offered to policyholders. At the end of the policy year, the proceeds from these call options are used to credit guaranteed returns to the policyholders’ account values.

An Equity Indexed Annuity is very similar to a normal Fixed Deferred Annuity…

Pricing a call option:  rocket science, but not really

EIA products rely on call options to provide guarantees on stock market returns.  So, it would be helpful to know the pricing formula for a call option.  It is shown below.  It looks like rocket science.  However, the stuff you need to know really isn’t that difficult.  (Warning:  Do not stare at the formula for too long.  It is like being blinded by headlights.)

( Source: https://en.wikipedia.org/wiki/Black–Scholes_model )

When applying this formula, most items are known and relatively easy to look up.  The spot prices are widely published.  The strike price is based on the guarantee.  For an EIA product, the normal time to maturity is 1 year.  It is not difficult to look up the risk-free rate of return at any moment of the day.  That only leaves “σ”, which is the volatility. This is the mystery number. I suppose one could look at either recent history, or long-term history, to measure volatility.  But that is not how it works.

With call options, there are two types of people.  There are people who want to buy call options.  This group is risk adverse.  Then there are people who want to sell call options.  This group includes risk takers.  There is a tendency for people to be risk adverse.  If we were to use the real volatility in the equation, there would not be enough people to sell call options.  The risk takers need an incentive.  They get this incentive by replacing “volatility” with a number referred to as “implied volatility”.

Implied volatility is greater than actual volatility.  This helps to ensure that people who sell call options have a long-term advantage over those who purchase call options.  Implied volatility is simply the volatility needed to get the number of people who sell call options to equal the number of people who want to buy call options.

People who buy call options are slightly worse off than those who sell call options. 

Managing an EIA product

At its base, an EIA product is very similar to a normal fixed deferred annuity.  Investment strategies for EIA products and normal fixed deferred annuities tend to be very similar.  The one big difference is that the investment income from the underlying portfolio of fixed income assets is used to purchase call options, as opposed to providing credited interest.  These call options support the guarantees.  This blog will not touch on the base investment strategy.  EIA product management does require the following:

  • Setting an Option Budget:  An option budget is the expected investment income from the underlying portfolio of fixed income assets that is available to purchase call options.  This would be the total amount of expected investment income less the amounts needed for general expenses, selling costs, profits, risk, etc.
  • Translating the Option Budget into Guarantees:  This seems straight forward.  Quoted call option prices can be compared to the option budget to set the guarantees for all new policies and annual renewals.  This must be done on a regular basis.  The amount available for an option budget will change based on expected investment performance.  Risk free rates and implied volatility play an important role in quoted call option prices.  These last two items can change suddenly. 
  • Adjusting Product Guarantees:  Competitive pressures and other company goals can affect the final guarantees declared at the beginning of each policy year. 

Applying Special New York Rules:  Please note that if your company is based in New York, the option budget translation into guarantees can effectively only be based on experience.  This includes changes to either the investment income on the underlying portfolio of fixed assets, or changes to call option prices.  Why do these rules exist?  EIA products generally have long surrender charge periods.  During the surrender charge periods, insurance companies can change guarantees at policy anniversary, just as long as they exceed policy minimums.  Some regulators have become concerned about the possibility of “bait and switch”.  (Please see NY Regulation 210 at https://www.dfs.ny.gov/docs/insurance/r_finala/2017/rf210txt.pdf ).

Could I make my own indexed annuity product?

Absolutely you can do something similar.  Go out and buy some bonds.  As coupons are paid, use these to purchase call options.  When the bonds mature you get your original principal back.  Positive stock market returns come from proceeds of the call options.  You probably do not want to do this without enough investment knowledge, but you now have the general idea. Keep in mind that such a strategy means taking on asset default risk.

Last Thoughts

EIA products will likely be popular with certain consumer segments.  They represent a relatively safe bet.  Many consumers like to believe they understand the stock markets.  For those who buy EIA products, there will be some years that they come out way ahead.  During these years, they will tell everyone they know.  During years that they do not come out ahead, chances are they will remain quiet.  It is the same principle that casinos have relied on for years. 

Are EIA products a good idea for customers over the long term?   The Internet is awash with many articles on this.  This is beyond the scope of this blog.

Do you have ideas for actuarial blogs?   Please write to me at dmxure@gmail.com.

Timing the Profits of an Insurance Company

In earlier blogs it became evident that many parties would like to control the timing of profits at insurance companies.  This includes state regulators, tax authorities, and those people who make up rules for publicly listed companies.  Some would like to see profits delayed.  Others would like to see profits emerge steadily.  Regardless of the timing, the total amount of profits over the life of an insurance product does not vary.  To this end, insurance companies produce three sets of financial statements to keep all parties happy.

This blog focuses on a spreadsheet which illustrates these concepts. (Click on the link below to download the file.)

https://dmxure.files.wordpress.com/2019/10/stat-to-gaap.xlsx

The spreadsheet has been designed for these people.

  1. New Actuaries – New actuaries who want to see how to convert between Statutory (government) and US GAAP (Wall Street) reporting.
  2. Auditors – Any new auditor who would like to understand controls used to ensure that Statutory and US GAAP calculations are consistent.
  3. Managers – Any product manager who would like to see what might be possible with a “Source of Earnings” analysis. 
  4. Accountants – Any new accountant who would like to have insurance company reserve calculations demystified.
  5. New Risk Managers – Understanding how things are tied together may be helpful in evaluating potential risks.
  6. People New to Insurance Pricing – The spreadsheet allows one to vary premium rates, and immediately see the impact to certain pricing metrics.

If you are not one of the above, looking at the spreadsheet may be a waste of time.  But if you are one of the above, you may end up reviewing the spreadsheet again and again.

Some Basic Mechanics

These elements are common to any insurance accounting rules.  This includes Statutory, Tax, US GAAP and IFRS reporting.  (Note: ∆ is shorthand for “The change in”.)

There you have it.  If you can figure out the above, then you have 90% of the problems licked.  Once this is understood, changing accounting bases is relatively easy.  Here are the basic rules for changing accounting bases.

  1. Complete the balance sheets, income statement, and capital roll forwards on the accounting basis that controls cash flows.  In the US, this is Statutory accounting, or the accounting done for State Insurance Commissioners.  Cash flows are control by Statutory accounting, as there are legal requirements to have assets at least as large as Statutory reserves.
  2. When switching from Statutory to some other accounting basis, the cash flows do not change.
  3. On the other hand, reserves, and some assets such as DAC, do change. Thus, to convert from Statutory to US GAAP, one switches out Statutory Reserves and replaces them with US GAAP reserves and DAC.

More on the Spreadsheet

It occurred to me that reading about spreadsheets can be long and tedious.  Sometimes it is better to have someone sit down with you and walk you through the spreadsheet.  Sorry, I can’t sit next to you, but I can show you the spreadsheet through a series of YouTube videos. 

An Introduction to the Spreadsheet
Assumptions Utilized for the Example
Statutory Financials (with some pricing explanations)
A Simplified Representative Statutory Reserve Calculation
US GAAP Financials
Source of Earnings Analysis
Spreadsheet Controls

Last Thoughts

Well those are the basics.  Of course, it can become much more complicated. 

  • Statutory calculations make use of specialized reserves such as the Interest Maintenance Reserve (IMR).
  • US GAAP rules split profits into two components.  The first is Net Income, and the second is Other Comprehensive income.  US GAAP makes use of deposit accounting for certain products. 
  • Both Statutory and US GAAP accounting have very complex rules for setting reserves. 

All of this will be discussed in future blogs. The most important thing to remember is that the choice of accounting basis will not affect the profits of the life of any given product.

Do you have ideas for actuarial blogs?  Send ideas to dmxure@gmail.com

Why Do Life Insurance Companies Have Reserves?

What the heck are reserves?  If one does anything with financial statements for life insurance companies, these seem to be a big deal.  Actuaries spend a lot of time computing these.  The insurance regulators, the IRS, and FASB make up a ton of rules about reserves.  Some accountants are frustrated with reserves, as they have an enormous impact on financial statements, but they are shrouded in mystery.

There are two reasons reserves exist:

  • To determine how much money to hold now in order to pay benefits in the future.
  • To control the timing of profits.

The second reason seems to be the more important reason.  Insurance commissioners, the IRS, and the FASB all want to control the timing of profits in some fashion through reserving practices.  Most companies produce at least three versions of reserves, which results in three income statements.  One of these statements is handed to state insurance commissioners.  A second is handed to the IRS.  The third and final version is used for financial reporting on Wall Street.

There are three sets of books, all perfectly legal. Like all actuarial work, it’s about the future, and the future is not certain.  Different parties have different viewpoints about how to recognize future events.

Regardless of which version is used, the amount of profits over the life a product does not vary, only the timing.  Three parties who want to control the timing of profits are:

  • Insurance Commissioners –One of the goals of income statements produced for insurance commissioners is to delay profits.These statements are referred to as Statutory.   Insurance products are dependent upon many assumptions, and insurance commissioners would like to delay profits just in case they are needed later for unexpected results.
  • IRS – The IRS of course wants tax money sooner, so their reserve rules work to accelerate profits.
  • Financial Accounting Standards Board – The FASB is one of the parties which set reserve calculation rules for publicly listed companies.  These rules are part of US Generally Accepted Accounting Principles (US GAAP).  They appear to want steady state profits.

Surprisingly enough, all of the rules in use tend to delay profits, even those used by the IRS.  Do insurance companies want to manage profits through reserving?  This topic will be discussed at the end.

*** Warning:  This blog is at a high level. It focuses only on traditional life products.   The full set of rules to compute reserves is quite complex.  This blog only explores concepts at a very general level. ***

The Most Basic Definition of Reserves

Life insurance products are generally very long term, with premium and benefit periods stretching out over several years. For example, a person may purchase a 20-year term life product.  This product consists of 20 years of premium payments, with a death benefit which can be paid at any time during that period. With this the most typical, but not the only, method for determining reserves is:

Projected Benefits & Expenses – Projected Premiums, Fees & Investment Income*

On the surface, this all makes sense.  If benefits and expenses are bigger than premiums, fees and investment income, then one needs to set up something on financial statements.  Then to be safe, any insurance company should have assets larger than reserves.

Then again, let’s think about this.  Most insurance products are priced for profitability.  Premium, fees and investment income should be bigger than benefits and expenses when the product is sold.  Basically, reserves would be negative when the product is sold.  They would represent the future profits of the product.  If one would sell something, all the future profits would be recognized on day one.  Yet this is not how it works in practice.

So, what happens?  For most accounting rules, first, one is not allowed to use full premiums in the above equation.  Second, one may put margins on assumptions used to compute projected benefits.  These two items control the timing of profits. Each accounting regime has different rules on how to handle these.

Why does one want to control profits?

  1. If one recognizes all of the profits up front, profits will be spent, or given to someone else.  Then if something goes wrong, there is no money to fix things.
  2. Recognition of all future profits at the time of sale was one of the things that led to downfall of Enron.  No, Enron was not an insurance company, but the same basic principles would apply.  They would start a project and recognize all of the profits up front.  And if the profits were not realized, they would simply start up another project.  Enron had other problems as well.
  3. Most life insurance products are around for several years.  Many would like to have profits distributed over the life of the products.

* Some people like to write this equation as the Present Value of Benefits and Expenses less the Present Value of Premiums.  The present value is determined using an interest discount rate.  The use of an interest discount rate is equivalent to using projected investment income.

Do Insurance Companies Manage Profits Through Reserves?

It may be possible to manage profits through assumption selection.  There is an incentive to managing profits. Short-term bonuses are often based on profits.  Having said this, such management is unlikely, and it will become even more unlikely in the future.

Actuaries are bound by a Professional Code of Conduct, and there is the Actuarial Board for Counseling and Discipline (ABCD) for enforcement.  Reserve calculations statements are reviewed by both regulator and external auditors.  In about 2 years, new US GAAP rules will require a number of new disclosures related to assumption selection.

While the process is not perfect, there are several safeguards to limit abuse.

Last Thoughts

One of the primary purposes of life insurance reserves is to manage the timing of profits.  There are many ways to manage such profits, with the insurance regulators, the IRS, and FASB all having different goals.  The next blog will provide spreadsheet demonstrations on how this works.

Reserving rules change all of the time.  Perhaps the best way to judge such rules is to determine how such rules will impact the timing of future profits.

Do you have ideas for actuarial blogs?  Send ideas to dmxure@gmail.com

How do I know if it’s credible?

Actuaries use assumptions for financial projections.  Assumptions include items such as mortality and policy lapse rates. Often these assumptions are based on a company’s own experience.  The experience represents a sample of a population.  The question is how much experience is needed for a good assumption.  Let’s consider an example.   The experience may indicate that the average lapse rate is 6%.  This particular experience set includes 25,000 policies.  The main question is whether or not the 25,000 policies is enough to make good decisions.

This can be a long topic.  I will focus on limited fluctuation credibility theory (LFCT).  Gee, that’s a long name.  It sounds precise.  Actually, it’s not.  Just like so many other things about the future, there is a great deal of subjectivity involved with measuring credibility. 

This blog will focus on the following.

  • How does one determine the amount of experience (sample size) needed for full credibility?
  • A spreadsheet which will help you with the calculations.
  • The items one must consider when using and communicating credibility concepts.

I promise not to get too much into the mathematics.  As you will see, at the end of the day over precision simply isn’t going to help that much.  Much of the actuarial value comes from the qualitative analysis associated with the process.

Determining the Number of Observations Needed for Full Credibility

How can one be certain that the right assumption has been chosen?  Well you can’t.  Some senior leaders may demand certainty.  When they get it, the senior leaders have just heard a lie.  Or at least a very misinformed statement.  Neither situation is good.

It is probably best not to focus on being absolutely certain, and instead choose a comfort point for reasonable certainty.  This comfort point is called full credibility.

Selecting a level for full credibility focuses on two items.

  • An allowable relative error, e.g., 10%.  This means that the rate found using experience is within 10% of the true underlying value.  So, if the rate from the sample is 6.0%, one would reasonably assume that rate for the population is between 5.4% and 6.6%.
  • A level of confidence, e.g., 99%.  This means that one is 99% certain that the rate from experience is within the allowable relative error.

Once one knows the relative error and confidence level, there is a convenient set of formulas to determine the necessary amount of experience for full credibility.  So, here is the question:  which of these combinations gives the best level of credibility?

  • (a) 95% confidence that one is within a 5% relative error of the true underlying value.
  • (b) 90% confidence that one is within a 3% relative error of the true underlying value.
  • (c) 90% confidence that one is within a 5% relative error of the true underlying value.

Most people probably can’t decide how to choose between (a) and (b).  This is where the subjectivity comes in. Option (b) actually requires twice as much experience as option (a).  So how did people originally choose between (a) and (b)?  It was likely because that sounded good, and that was exactly the amount of experience they had on hand at that time.  Then they stuck with it.

Number of Observations Needed for Full Credibility

Level of
Confidence
Allowable
Relative
Error
Approximate
Number of
Deaths (Lapses)
90% 3% 3,000
95% 5% 1,500
90% 5% 1,000

These three combinations of confidence and relative error shown in the table are the most common ones seen in practice.  The relative levels are rarely explained or compared.  Someone typically uses a combination because they have seen it somewhere else.

A few notes are in order:

  • The amount of experience needed to achieve full credibility is typically based on the number of deaths (lapses).  This is because varying the mortality rate does not affect the number of deaths to achieve credibility by much.  The table can be rewritten based on the number of observations, but it would need to be updated for each mortality rate.
  • The number of deaths needed for full credibility will vary slightly by how one approximates the confidence interval, but this may not be that significant.  One can find several formulas.
  • There are many unknowns.  Hence it probably does not make too much sense to get too worried about accuracy.  Many people lack rationale for (a) vs. (b).  Probability distributions are constantly changing. 
    • Mortality is improving (statins, better diets) …sometimes.
    • Mortality is declining (opioids, dying while texting) …. sometimes.
    • Policyholder behavior, such as lapses, changes continually based on information available to the policyholder, the economic environment, and a variety of other factors.
  • Having said all of this, under the Principles Based Reserving rules for government reporting, the number of observations needed for full credibility for mortality does vary by age. https://www.naic.org/documents/prod_serv_2018_valuation_manual.pdf    

Amount of Experience for Full Credibility Spreadsheet

(Below is the link to download the spreadsheet)

https://dmxure.com/media/lfct.xlsx

The LFCT spreadsheet at this site is a tool for determining the amount of experience needed for full credibility.  There are three inputs: 

  • The level of confidence
  • The allowable relative error 
  • The expected rate of mortality or lapse

This spreadsheet can be downloaded.  It is macro-free so it should be safe.  The spreadsheet relies on the “Solver” Excel Add-in.  The “Solver” add-in is free and in comes with all recent versions of Excel.  Like any spreadsheet, improvements can be made.  If you have ideas for improvements, please send me a note at dmxure@gmail.com.  I will even add your name as a credit for changes, but only if you want your name added.

How to Determine Partial Credibility

This isn’t too hard.  Partial credibility is defined as:

*The term deaths can be replaced with lapses or some other decrement.

So, if the number of deaths in your experience database is 374, and the amount needed for full credibility is 3,000, then the partial credibility is 35%.

How to Apply Credibility

To set an assumption using credibility, the experience data is combined with an established assumption.  The most common method is:

New Assumption = Experience Rate * Credibility + Established Assumption* (1 – Credibility)

There are a couple of items which make the application difficult.

  1. How does one find an established assumption?
  2. How does one group data?

Established tables for mortality can be found at https://mort.soa.org/.  The Society of Actuaries at the time of this writing had 3,006 tables in their repository.  The tables vary by country, type of product, underwriting, etc.  It may take some time to find a table that matches up with the characteristics of your product.  Communication about how an established table was chosen can be critical to evaluating the process.

Established tables for lapses are more difficult.  Lapse rates by company and product can vary greatly.  The distribution method, e.g., independent agents vs. career agents, can make a large impact.  Possible choices for established tables may be tables for similar products, tables available from consultant services, or simply the table that was last used.  The subjective quality of established tables may play a role on how to apply credibility.  This is where communication becomes critical.  Decision makers must understand the qualitative aspects of the established table to determine the appropriateness for assumptions setting.

Grouping of data is often necessary to apply credibility.  An insurance company may have over 50,000 mortality rates which vary by age, sex, policy duration, underwriting class, location, etc.  Establishing credibility for all of these rates may be impossible.  Grouping of rates can help.  This may best be seen in an example. 

Suppose that an actuary picks the 2008 VBT mortality table as the established table.  Then suppose that experience data comes in at 94% of the established table.  This percentage methodology essentially groups all of the mortality rates.  The experience data has 590 deaths. The insurance company, after long discussions, has set full credibility at 1,500 deaths.   The new assumption becomes 96.2% of the 2008 VBT.

This methodology groups all of the mortality rates into a single number as a percentage of an established table. When such a methodology is applied, the percentage is often graded to 100% beginning at an advanced age, say 85.  Experience is typically limited above this point.  It is also desirable to get a mortality rate of 100% at some age, e.g., 120.  Alternatively, some actuaries will group data into age bands when determining credibility.

Data for Deferred Annuity products are often grouped by phase for the purposes of determining credibility of lapse assumptions.  There are three main phases.

  • Surrender Charge Period – A surrender charge may exist for a period of say 7 years.  During that period, lapses tend to be very low, as policyholders wish to avoid the surrender charges.
  • Shock Lapse Period – Lapse rates can shoot up to 40% or higher in the year following the end of the surrender charge period.  Distribution agents are looking for their next commission, and hence have strong incentives to get people to change products.
  • Ultimate Period – Beyond the shock lapse period, lapses tend to level off.   Having said this, few insurance companies have experience for policies at very late policy durations.

Examples and thoughts about established tables and grouping are too numerous to mention in a short blog.  More information may be forthcoming in future blogs.

Last Thoughts

This blog only scratches the surface of using credibility.  Due to the subjective nature of the process, credibility should always be thought of as a guideline as opposed to an absolute rule.  Understanding how the level of full credibility was chosen is important.  Even more important are the decisions on established assumptions and how to group the data.  Communication is critical to a well-designed process.

Wouldn’t be nice if all insurance companies gave more information about how they set assumptions?  Well that is coming.  At least it is coming for publicly traded companies with new accounting rules (ASU 2018-12).(https://www.fasb.org/jsp/FASB/Document_C/DocumentPage?cid=1176171066930&acceptedDisclaimer=true).  These rules will not become effective for about 2 years.  When they do, they will require greatly increased public disclosure about assumption setting.

More blogs to come.  Send thoughts or requests for specific topics to dmxure@gmail.com.

What is a DM XURE?

Thanks for joining me!

I used to live in Des Moines. Des Moines has been called ths insurance capital of the US*. I am an actuary. Hopefully you have figured out the meaning of DM XURE.

At one point I had a customized license plate, “DM XURE.” So I went to visit my mother. I said, “Mom, isn’t this great? XURE sounds just like actuary.”

Her response was, “So does that mean damn actuary?”

This is what Des Moines looks like without presidential candidates.

*https://www.freeenterprise.com/the-insurance-capital-of-the-u-s-look-to-des-moines/